Given
In the market for strawberries, the demand is P = 30 − 2Qd and the supply is P = 10 + 2Qs.
Question a
What is the equilibrium price and quantity for strawberries?
Hint
Set demand equal to supply: 30 − 2Q = 10 + 2Q. Solve for Q, then plug back in.
Explanation
Setting 30 − 2Q = 10 + 2Q gives 20 = 4Q, so Q* = 5. Plugging back in: P* = 30 − 2(5) = $20. At this price, quantity demanded equals quantity supplied.
Question b
What is the Consumer and Producer Surplus?
Hint
CS is the triangle above the price and below demand. Use the area formula: ½ × base × height.
ExplanationCS = ½ × (30 − 20) × 5 = ½ × 10 × 5 = $25. The demand intercept is $30, equilibrium price is $20, so the height of the CS triangle is $10, and the base is 5 units.
PS = ½ × (20 − 10) × 5 = ½ × 10 × 5 = $25. The supply intercept is $10, so the height of the PS triangle is also $10.
New scenario
Suppose the local government wants to help strawberry farmers and places a price floor of $24.
Question c
What is the surplus (excess supply) created by the price floor?
Hint
Find Qd and Qs at P = $24, then subtract. Remember: the floor is above equilibrium.
Explanation
At P = $24: Qd = (30 − 24) / 2 = 3 units. Qs = (24 − 10) / 2 = 7 units. Surplus = 7 − 3 = 4 units of excess supply. Farmers want to sell 7 but buyers only want 3.
Question d
What is the new consumer and producer surplus after the price floor?
Hint
Only 3 units are traded (quantity demanded at $24). CS is now a smaller triangle. PS is a trapezoid — draw it out!
Explanation
Only Qd = 3 units are actually traded (you can't force buyers to buy).
CS = ½ × (30 − 24) × 3 = ½ × 6 × 3 = $9.
PS: sellers receive $24 for 3 units, and their costs range from $10 to $16 (supply at Q = 3: P = 10 + 6 = 16). PS is a trapezoid: ½ × (24 − 10 + 24 − 16) × 3 = ½ × (14 + 8) × 3 = $33. Alternatively: PS = (24 − 10)(3) − ½(16 − 10)(3) = 42 − 9 = $33.
Question e
What is the deadweight loss from the price floor?
Hint
DWL = Old Total Surplus − New Total Surplus. Or calculate the triangle between the curves from Q = 3 to Q = 5.
Geometrically, the DWL is the triangle with vertices at (Q = 3, P = $24), (Q = 5, P = $20), and (Q = 3, P = $16). Its area = ½ × ($24 − $16) × (5 − 3) = ½ × $8 × 2 = $8. These are gains from trade that no longer happen because the price floor prevents those units from being traded.
Part 2
Multiple Choice
Figure 7-1
Question 1
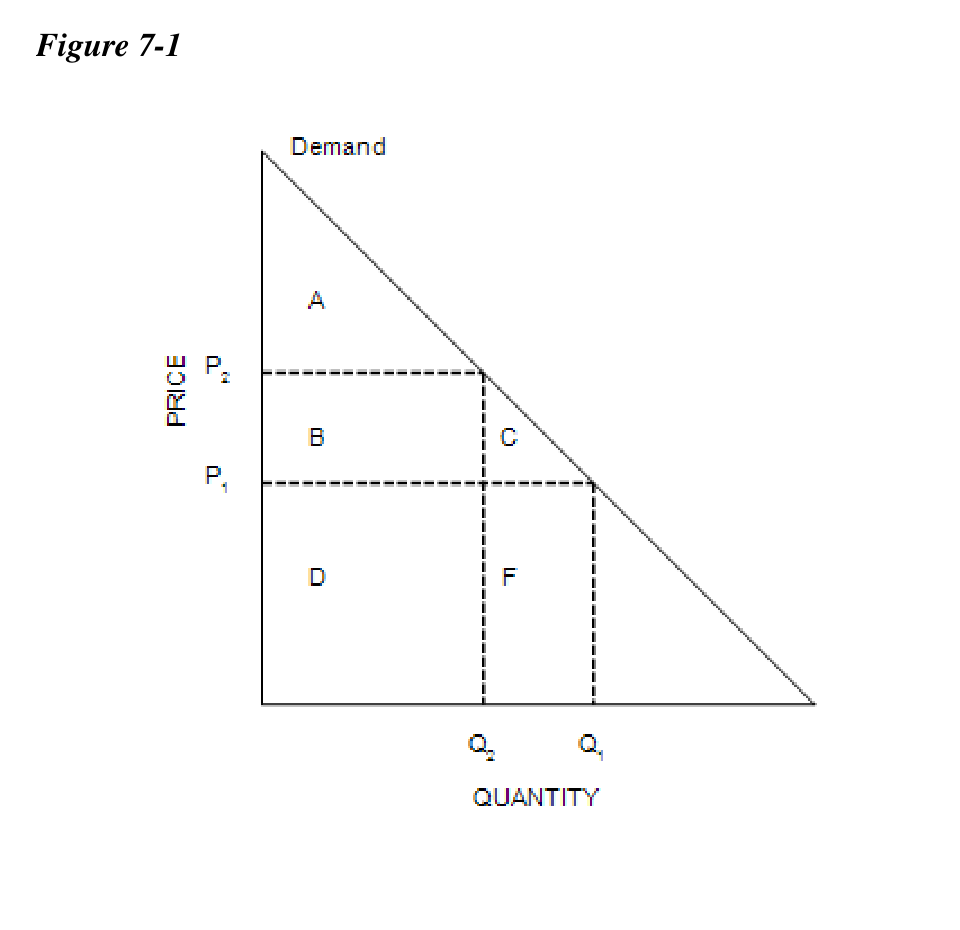
Refer to Figure 7-1. When the price is P₂, consumer surplus is
Hint
Consumer surplus is the area above the price line and below demand. At P₂, which areas are above the P₂ line?
Explanation
At price P₂, consumer surplus is the triangle above P₂ and below the demand curve, from Q = 0 to Q₂. That's just area A. Areas B and C are below P₂, so they're not part of consumer surplus at that price. Area D is below P₁, even further from consumer surplus at P₂.
Question 2
Refer to Figure 7-1. Suppose the price falls from P₂ to P₁. Area B represents the
Hint
When price drops from P₂ to P₁, existing buyers (who were already buying at P₂) now pay less. What area captures their additional benefit?
Explanation
When price falls from P₂ to P₁, buyers who were already purchasing at P₂ (quantity Q₂) now pay a lower price. The rectangle B (between P₁ and P₂, from 0 to Q₂) represents the extra surplus those initial consumers gain. Area C represents the surplus gained by new consumers (Q₂ to Q₁) who enter the market at the lower price.
Figure 7-2
Question 3
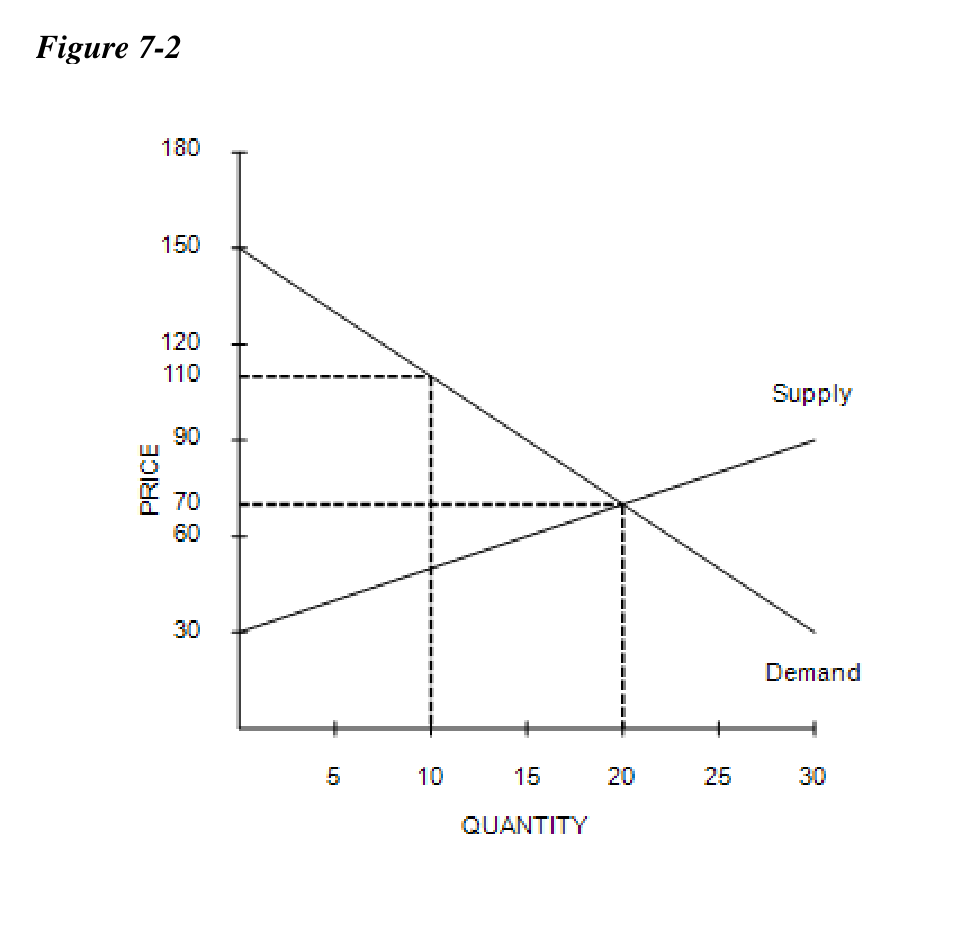
Refer to Figure 7-2. At the equilibrium price, consumer surplus is
Hint
Read the graph: the demand intercept (price at Q = 0) is $150, equilibrium price is $70, and equilibrium quantity is 20. Use ½ × base × height.
Explanation
From the graph, equilibrium is at Q = 20, P = $70. The demand curve intercepts the price axis at $150. CS = ½ × (150 − 70) × 20 = ½ × 80 × 20 = $800.
Question 4
Refer to Figure 7-2. If the government imposes a price floor of $110, consumer surplus will decrease by
Hint
At P = $110, find Qd from the graph (about 10 units). Calculate the new CS, then subtract from the original.
Explanation
The question asks for the decrease in CS, not the new CS. Decrease = Original CS − New CS = $800 − $200 = $600. (Computing the new CS: at P = $110, Q ≈ 10 from the graph, so new CS = ½ × (150 − 110) × 10 = ½ × 40 × 10 = $200.)
Table 7-11
Question 5
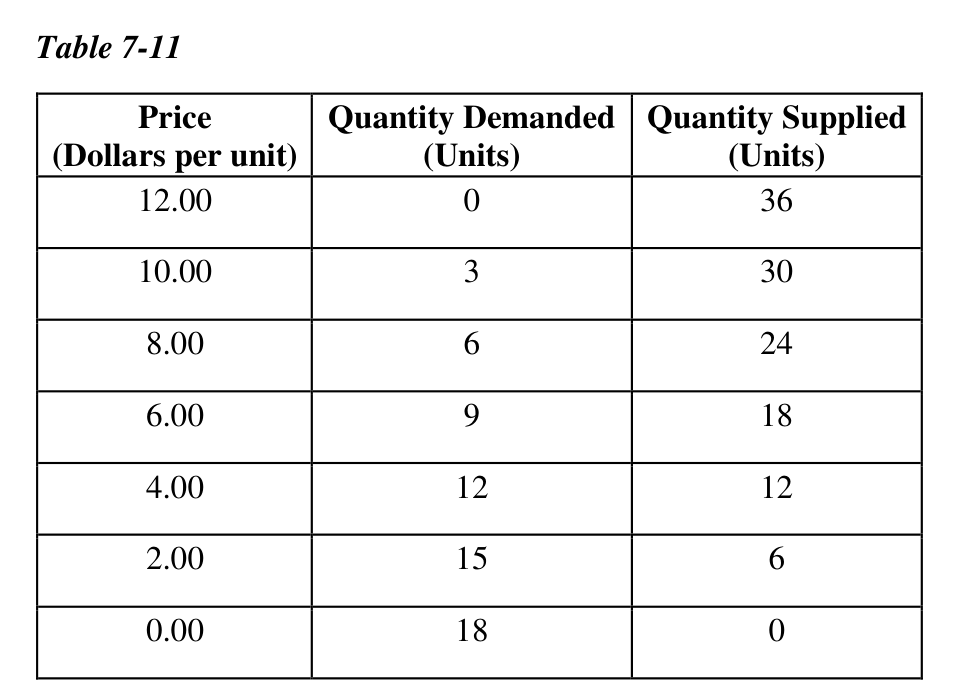
Refer to Table 7-11. The equilibrium price is
Hint
Equilibrium is where quantity demanded equals quantity supplied. Scan the table for the row where Qd = Qs.
Explanation
At P = $4.00, Qd = 12 and Qs = 12. This is the only price where quantity demanded equals quantity supplied, making it the equilibrium. At every other price, there's either excess demand (P < $4) or excess supply (P > $4).
Question 6
Refer to Table 7-11. At a price of $2.00, total surplus is
Hint
At P = $2, Qd = 15 but Qs = 6. How many units actually trade? And what happens to the gains from units 7–12 that would have traded at equilibrium?
Explanation
At P = $2.00, Qs = 6, so only 6 units trade (sellers won't supply more). At equilibrium, 12 units trade. The 6 units between Q = 6 and Q = 12 represent lost gains from trade. Since quantity deviates from the efficient level (12 units), total surplus must be smaller than at equilibrium. Free markets maximize total surplus; any deviation reduces it.
Question 7
A simultaneous increase in both demand and supply of tablets would imply that
Hint
What shifts demand right? What shifts supply right? Think about what each shift implies about underlying values and costs.
Explanation
Demand increases when consumers value the good more (willing to pay more at every quantity). Supply increases when production costs fall (sellers willing to supply more at every price). So: value to consumers increased (demand shifts right) AND cost of producing decreased (supply shifts right).
Question 8
Efficiency in a market is achieved when
Hint
Efficiency is about maximizing total gains from trade. What economic measure captures total gains?
Explanation
Market efficiency means maximizing total surplus (CS + PS). This happens at the free-market equilibrium where every unit with buyer value > seller cost gets traded. A social planner would reach the same outcome, but markets do it automatically via the price mechanism — Adam Smith's "invisible hand."
Part 3
True or False
Question 9
Consumer surplus is the amount a buyer is willing to pay minus the amount they actually pay.
Hint
This is the textbook definition. Willingness to pay − actual price = ?
ExplanationTrue. This is exactly the definition. CS for a single buyer = willingness to pay − market price. Summed across all buyers, CS = the area above the market price and below the demand curve.
Question 10
An increase in supply that reduces price increases consumer surplus because (1) existing buyers gain more surplus and (2) new buyers enter.
Hint
When price falls, existing buyers pay less (more surplus per unit). And at the lower price, some new buyers who wouldn't buy before now enter. Both true?
ExplanationTrue. Both effects are real. (1) Existing buyers were paying the old (higher) price. At the new lower price, they each gain more surplus. (2) The lower price makes the good affordable for buyers whose willingness to pay was between the old and new price — these new buyers enter the market and gain consumer surplus too.
Question 11
An increase in price increases consumer surplus.
Hint
When price goes up, what happens to the area above price and below demand?
ExplanationFalse. When price increases, the area above the price line and below the demand curve shrinks. Buyers pay more, so the gap between their willingness to pay and the actual price narrows. Higher price → less consumer surplus.
Question 12
If the government imposes a binding price ceiling, producer surplus increases.
Hint
A binding price ceiling is below equilibrium. Sellers are forced to accept a lower price...
ExplanationFalse. A binding price ceiling is set below equilibrium, forcing a lower price. This means sellers receive less per unit AND fewer units are sold (quantity supplied falls). Both effects reduce producer surplus. Sellers lose on price AND volume.